GSoC 2018 Final: Debugging and Emulation Support for Cutter
August 20, 2018
Intro
Hi, I’m mandlebro and during the summer I worked on the GSOC project “Debugging and Emulation Support for Cutter”. The goal of this GSOC project was to integrate radare2’s debugging and emulation capabilities in Cutter.
You can check all my commits in the following links:
Developed features
During the duration of the project I both worked in radare2 and Cutter. On radare2 side I provided a json interface to existing r2 commands so that they could be well parsed on Cutter side as well as worked on some ESIL features. Here are some of the main implemented features:
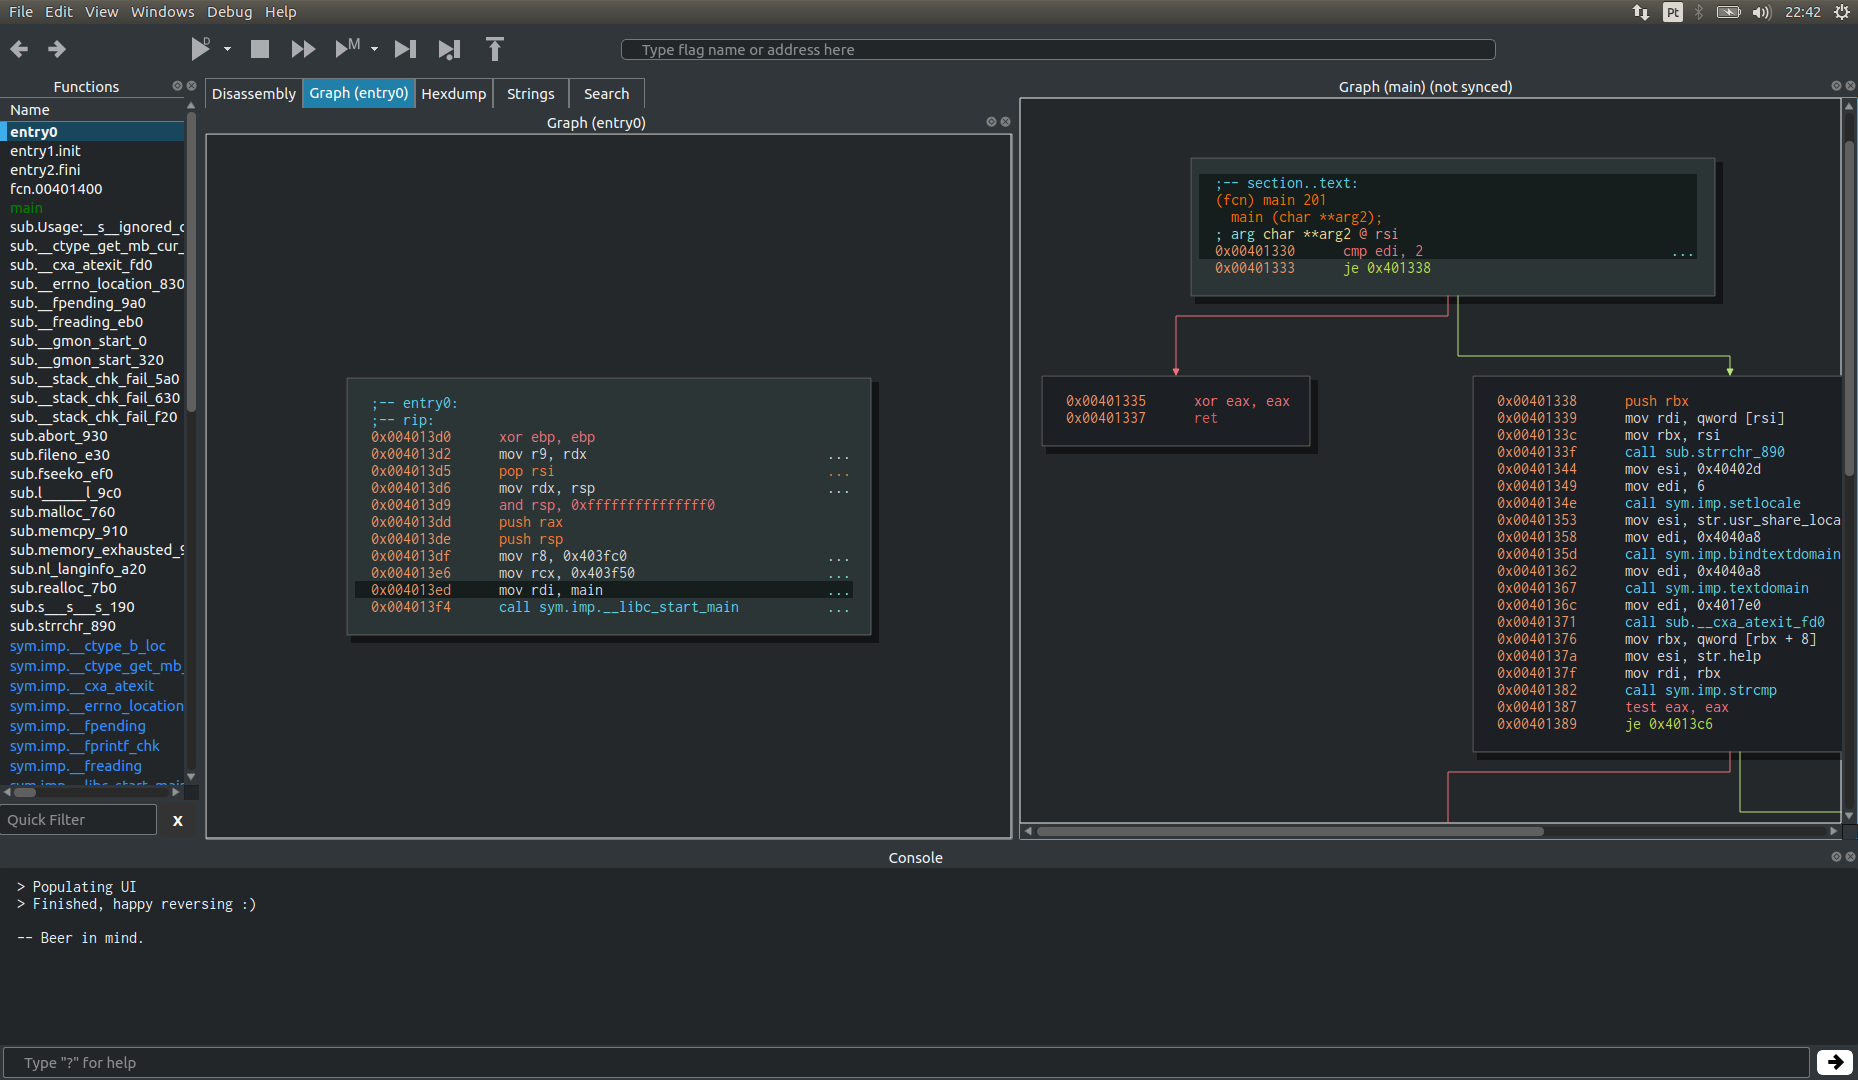
Multiple panels and independent seeks
- Independent seeks: you can now have different widgets with different seeks. Previously, all widgets would always be in sync with each other, and with the radare2 instance running in the background.
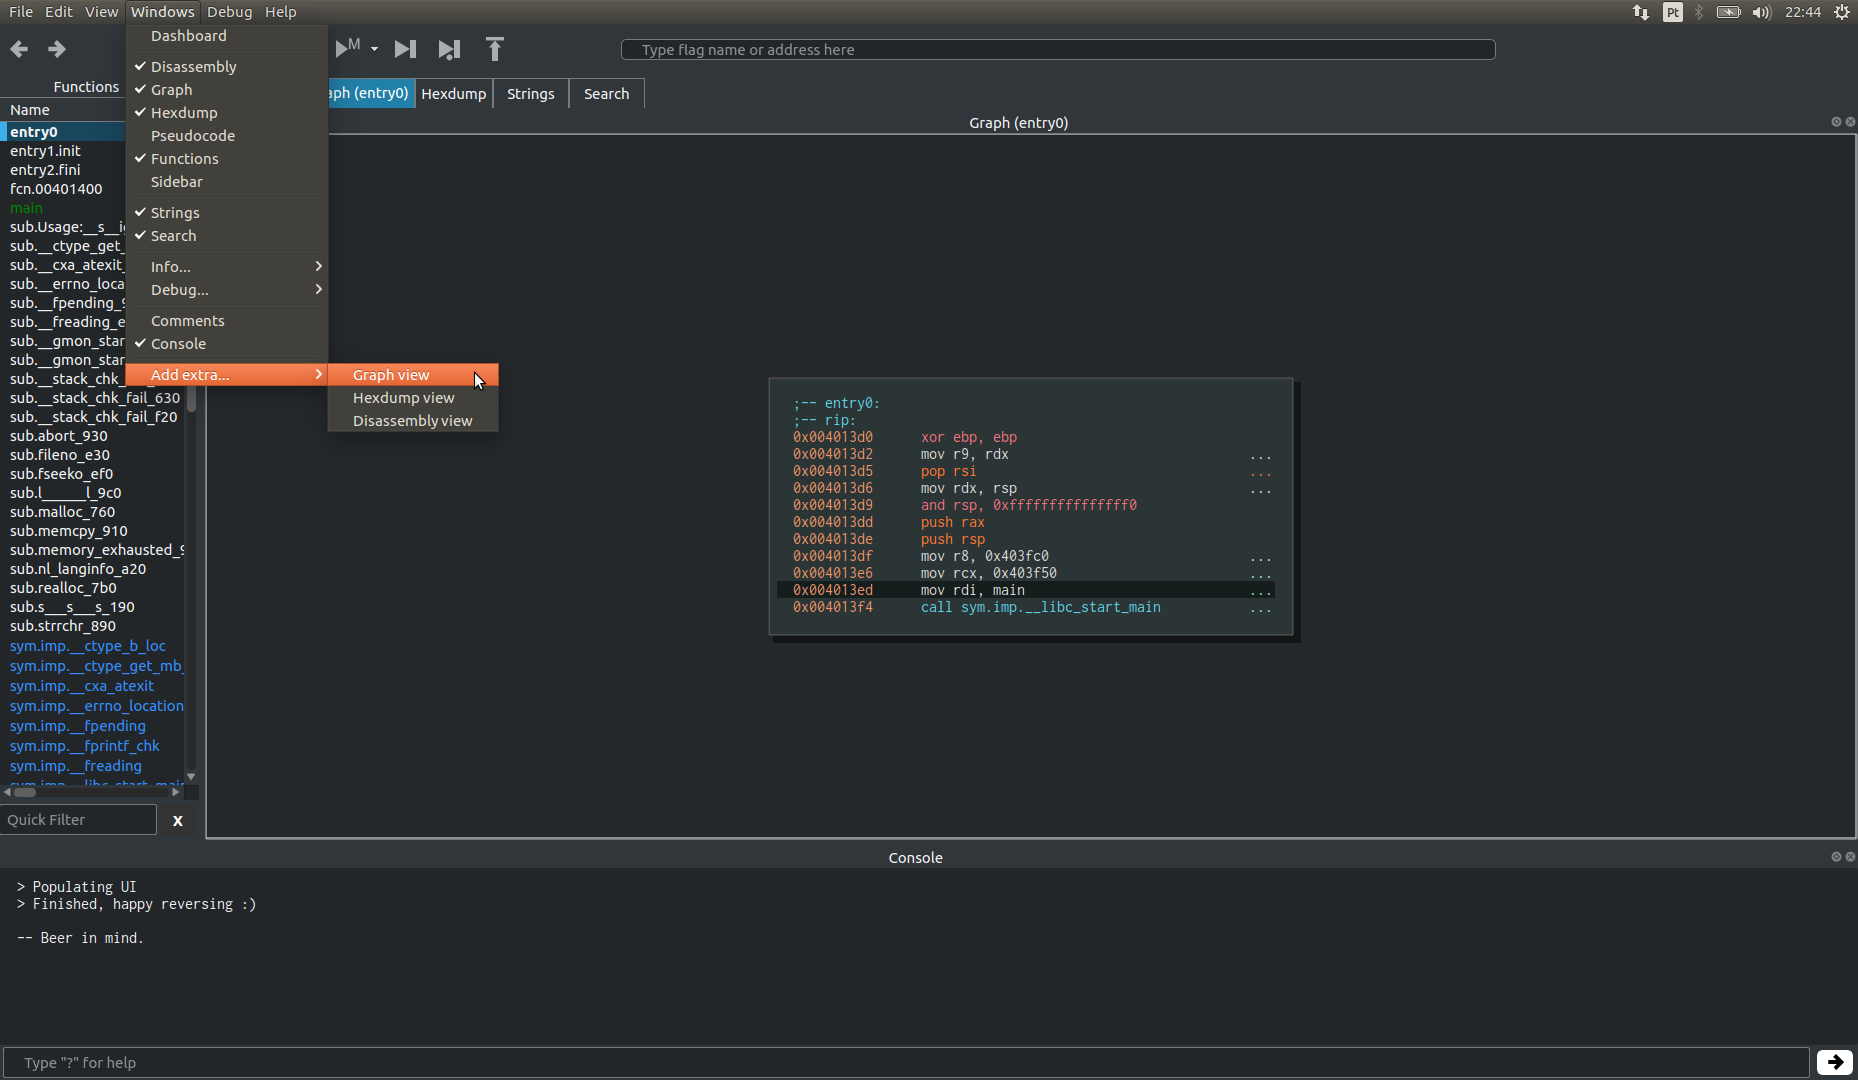
- Multiple widgets: you can now open more than one instance of the same widget. This means that you can now look at several functions in graph/linear mode at the same time via the menu
Windows->Add extra...:
Debug and emulation actions
There are several ways to interact with the debugging/emulation engine running:
- Debug toolbar which has buttons for all supported debugging actions. These are:
- Start debug/emulation/attach to a process;
- Stop debugging/emulation/detach from process;
- Continue execution;
- Continue until main/syscall/call;
- Step into, step over, step out.
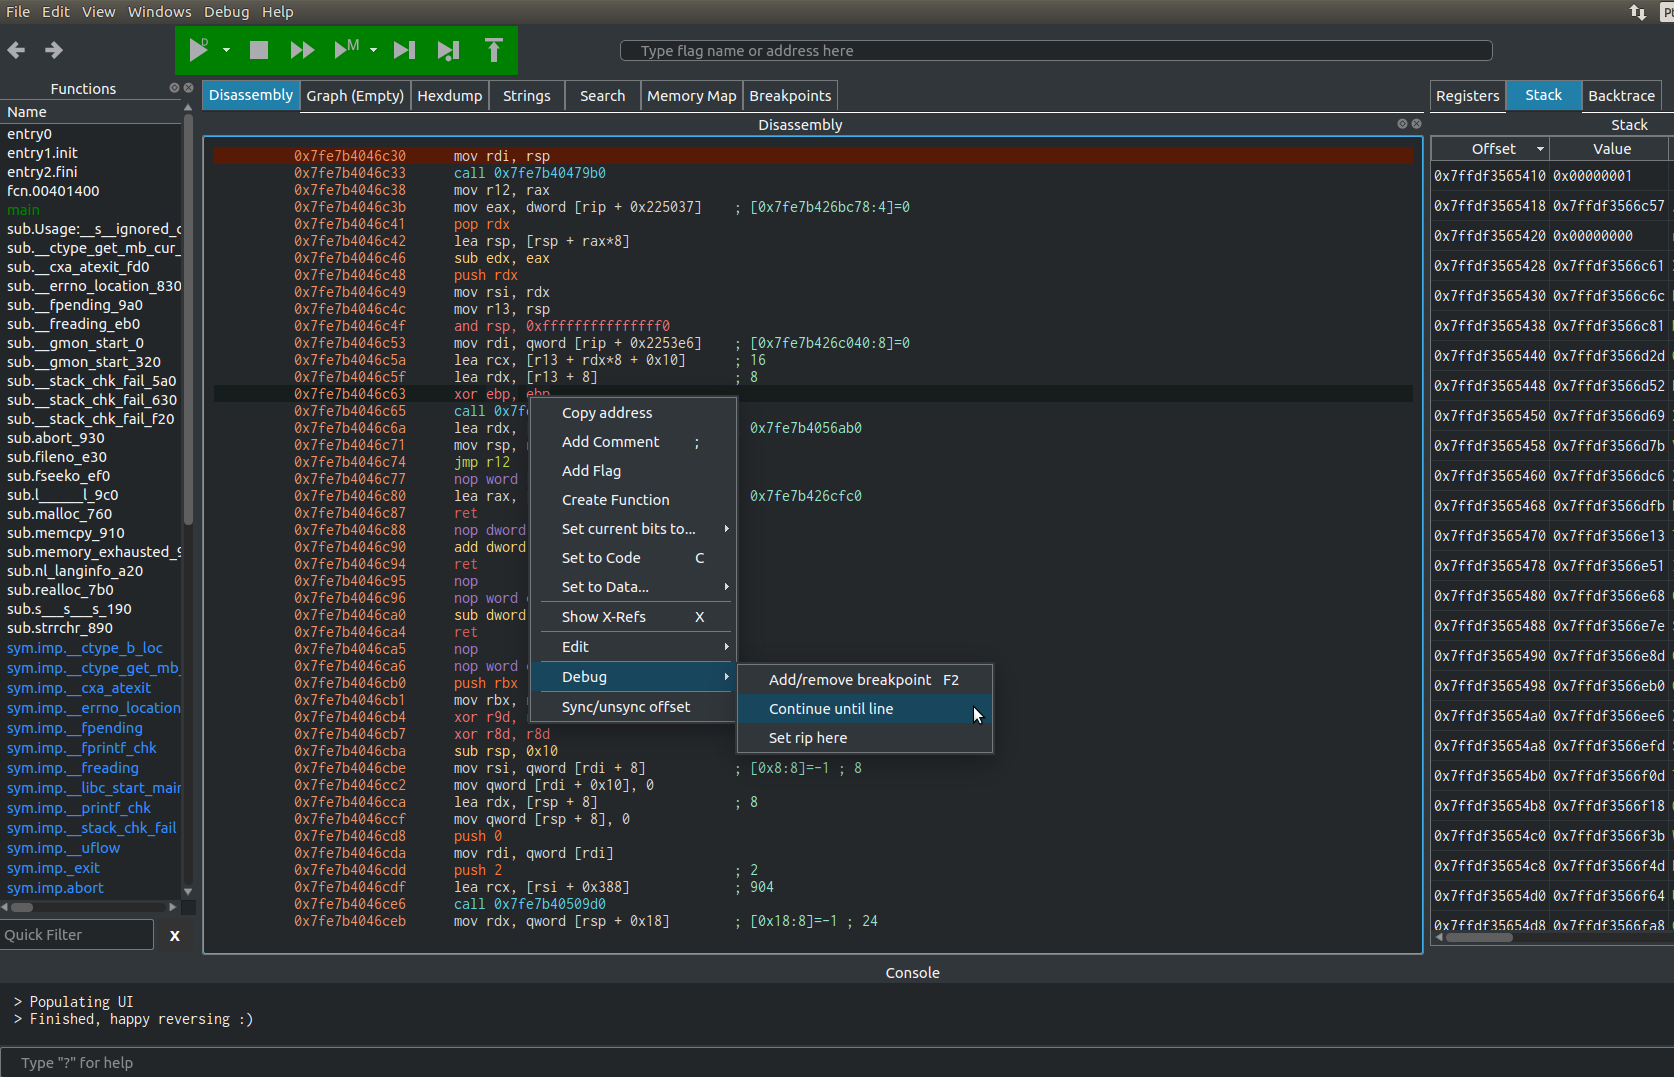
- Context menu which allow for actions that usually depend on a offset and is accessed by
Right clicking->Debug:- Add/remove breakpoint;
- Continue until line;
- Set $ProgramCounterName here;
Debug and emulation widgets
Currently the following widgets related to debugging are available:
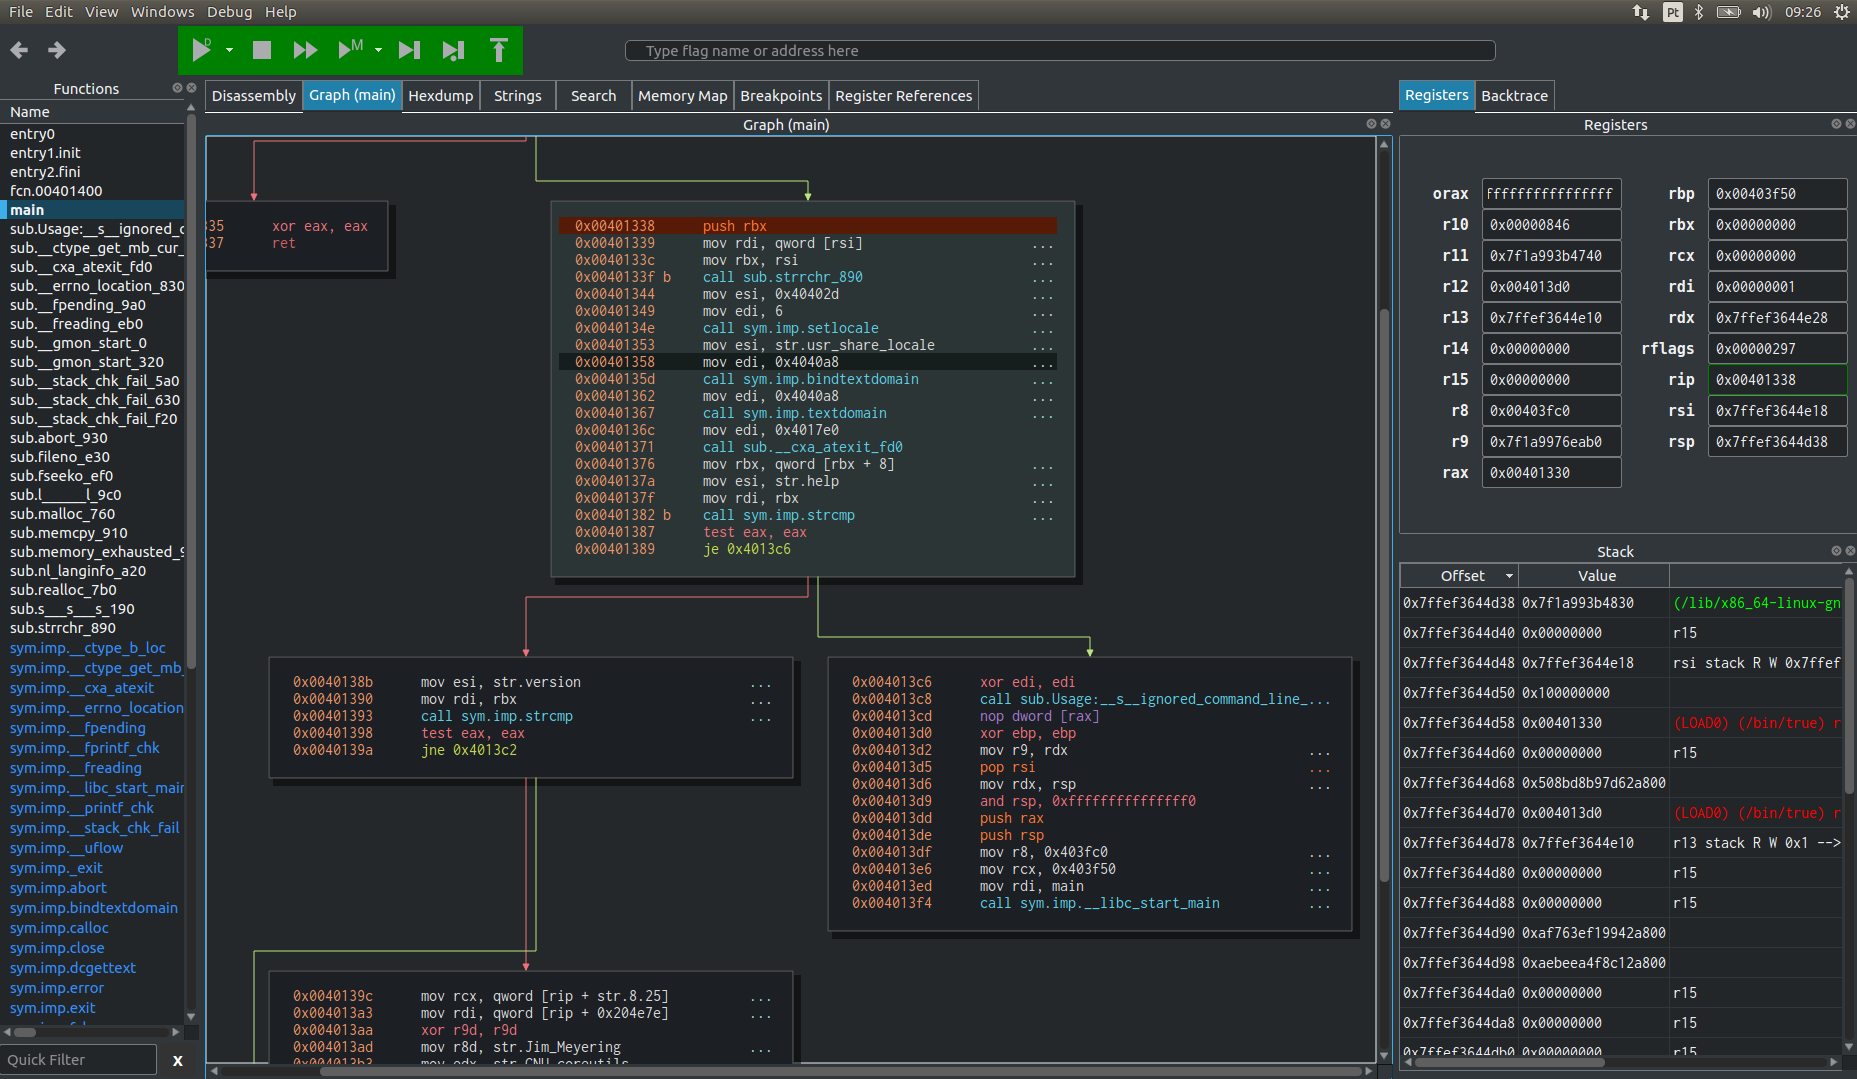
- Registers widget:
- allows to change a register by editing its value;
- hovering over a register displays the register telescoping;
- the registers that changed value in the last debugging action are highlighted green;
- Stack widget: allows to view the stack, edit stack addresses and seek to addresses in the stack.
- Breakpoint widget:
- displays all current breakpoints
- allows to delete a single breakpoint or all breakpoints
- allows to toggle a breakpoint inactive;
- add breakpoints by providing a series of offsets separated by space.
- Backtrace widget displays backtrace information;
- Register references widget displays register telescoping.
- Memory map widget displays the mapped regions and their permissions.
ESIL
In the last leg of the project I also devoted some time to ESIL and implemented some of interesting features:
- Breakpoints now work in ESIL emulation: previously when emulating, continuing the execution with
aecwould not stop at inserted breakpoint. Now ESIL emulation shares the same set of breakpoints as the radare2 debugger. - ESIL continue until call: Although most debugger
continue until ...commands were also implemented in the ESIL emulation,continue until callwas missing and is now available withaecc - Eval variable to break emulation on invalid instructions: Prior to ESIL breakpoints, when running continue command
aecon ESIL emulation, we will most likely start trying to emulate zones of memory/instructions that are not there since they were not loaded as would happen in a real running instance of the binary. And ESIL emulation would happily sled on those invalid instructions until ^C. Now you can change this behaviour by changing the value ofesil.breakoninvalidto true using the r2 commande esil.breakoninvalid = true.
What is missing
Although the debugger and emulation work fine there are still some issues which probably require major work on r2 debugger and were not sucessfully finished. Both issues lie with radare2’s debugger being developed to be used from the single threaded process which is radare2, and not a multiple threaded GUI like Cutter.
Specifically, the problem lies in the interface with the debugee program, ptrace. Although it is a very powerful interface to another process, allowing to access registers, read and write the program memory, etc., this all must be done from the same tracer thread.
- Console widget: Cutter already uses background tasks in the console widget. This however means that when we are debugging and try to inspect the program memory in the console, a new thread will do that work and run the
ptracecommand. As mentioned before, this will fail sinceptraceonly allows one thread to make calls to the debuggee. A way to solve this would be to wrap allptracecalls in a way that even if different threads try calling it, always the same tracer thread will actually callptrace. - stdin: When the debugee process asks for input, or is left running, all context is switched to that process until an input is given or ^C is sent. This means that during that time, all the Cutter widgets will freeze since they cannot update.
Thanks
I would like to sincerely thank xarkes, Florian and Maijin for the support during the project!