Interactive ASCII graphs
February 6, 2015
The graph feature of IDA, ImmunityDBG or Hopper are great to have a quick overview of what you’re dealing with. This is why we have graphs too in radare2, but since we’re terminal-lovers, ours are cooler in ASCII!
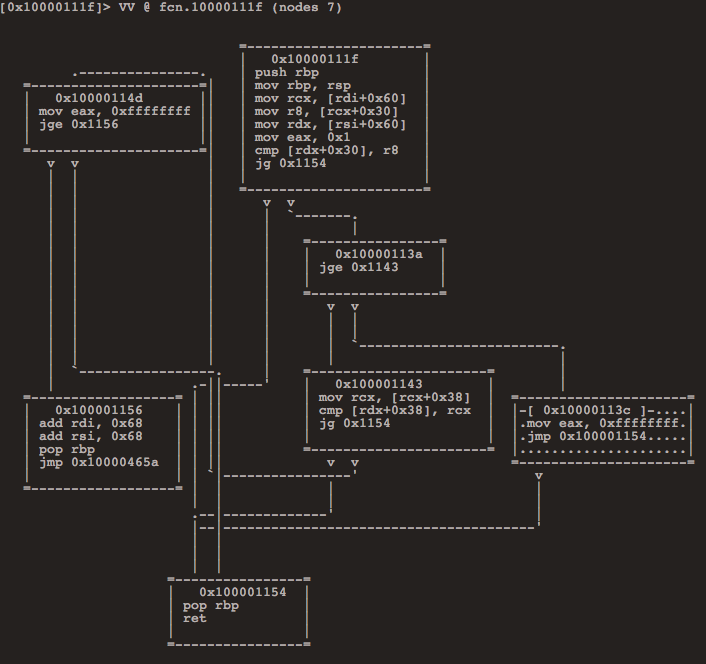
After analyzing a function with af or any other method, type VV to get:
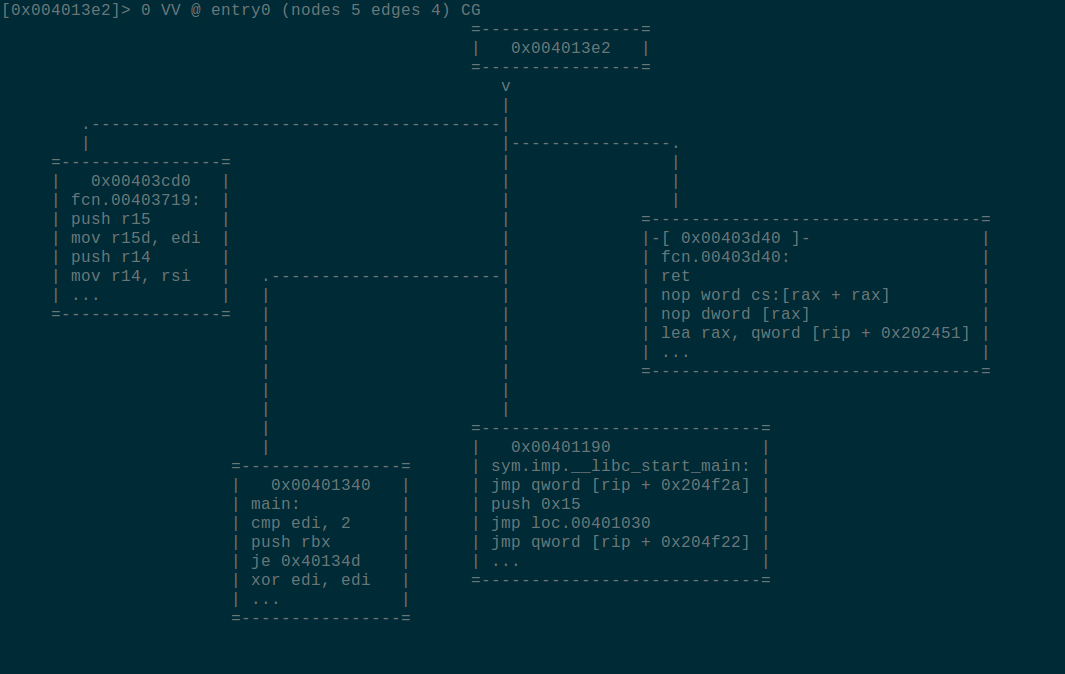
We’ve got call graphs, which are way more understandable than simply listing the XREF adresses. To see it, simply press V when you’re in graph mode.
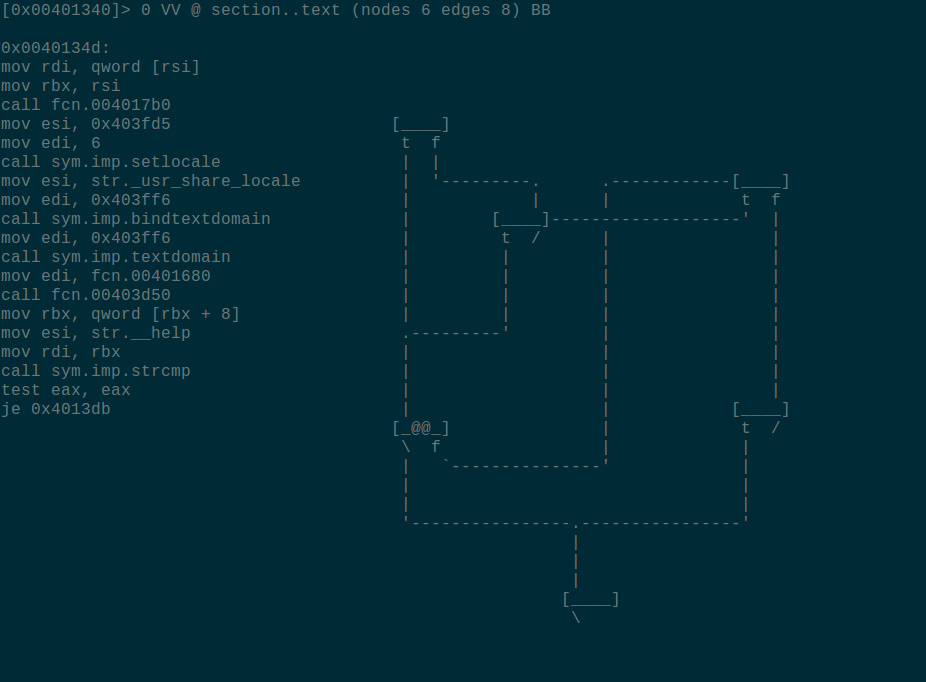
Unfortunately, the classic 80x24 terminal size is not that convenient when it comes to having an overview of a big function. This is why we also have VVn, to show a mini-graph.
On the left, you can see the code of the current node (The one with @@ on it. You can switch nodes with <tab>). The t branche stands for true and f for false.
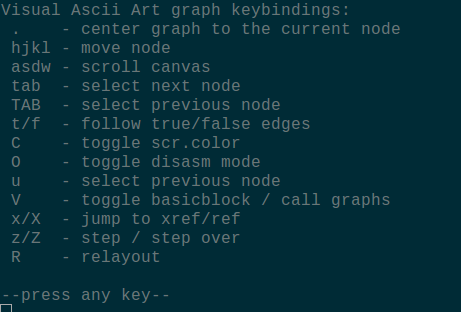
Every graph is interactive: you can move their nodes around, walk them (t,f,u), show bytes/flags (O), debug within them (z/Z), jump around xrefs (x/X), …
To scroll the RConsCanvas use the asdw keys. The hjkl ones are used for moving the nodes around. Also bear in mind that ASDW and HJKL will do the same as the lowercase ones, but faster!
And of course, it’s documented, with ?
If you think that we’re missing your favourite type of graph, feel free to come rant about this on irc ;)
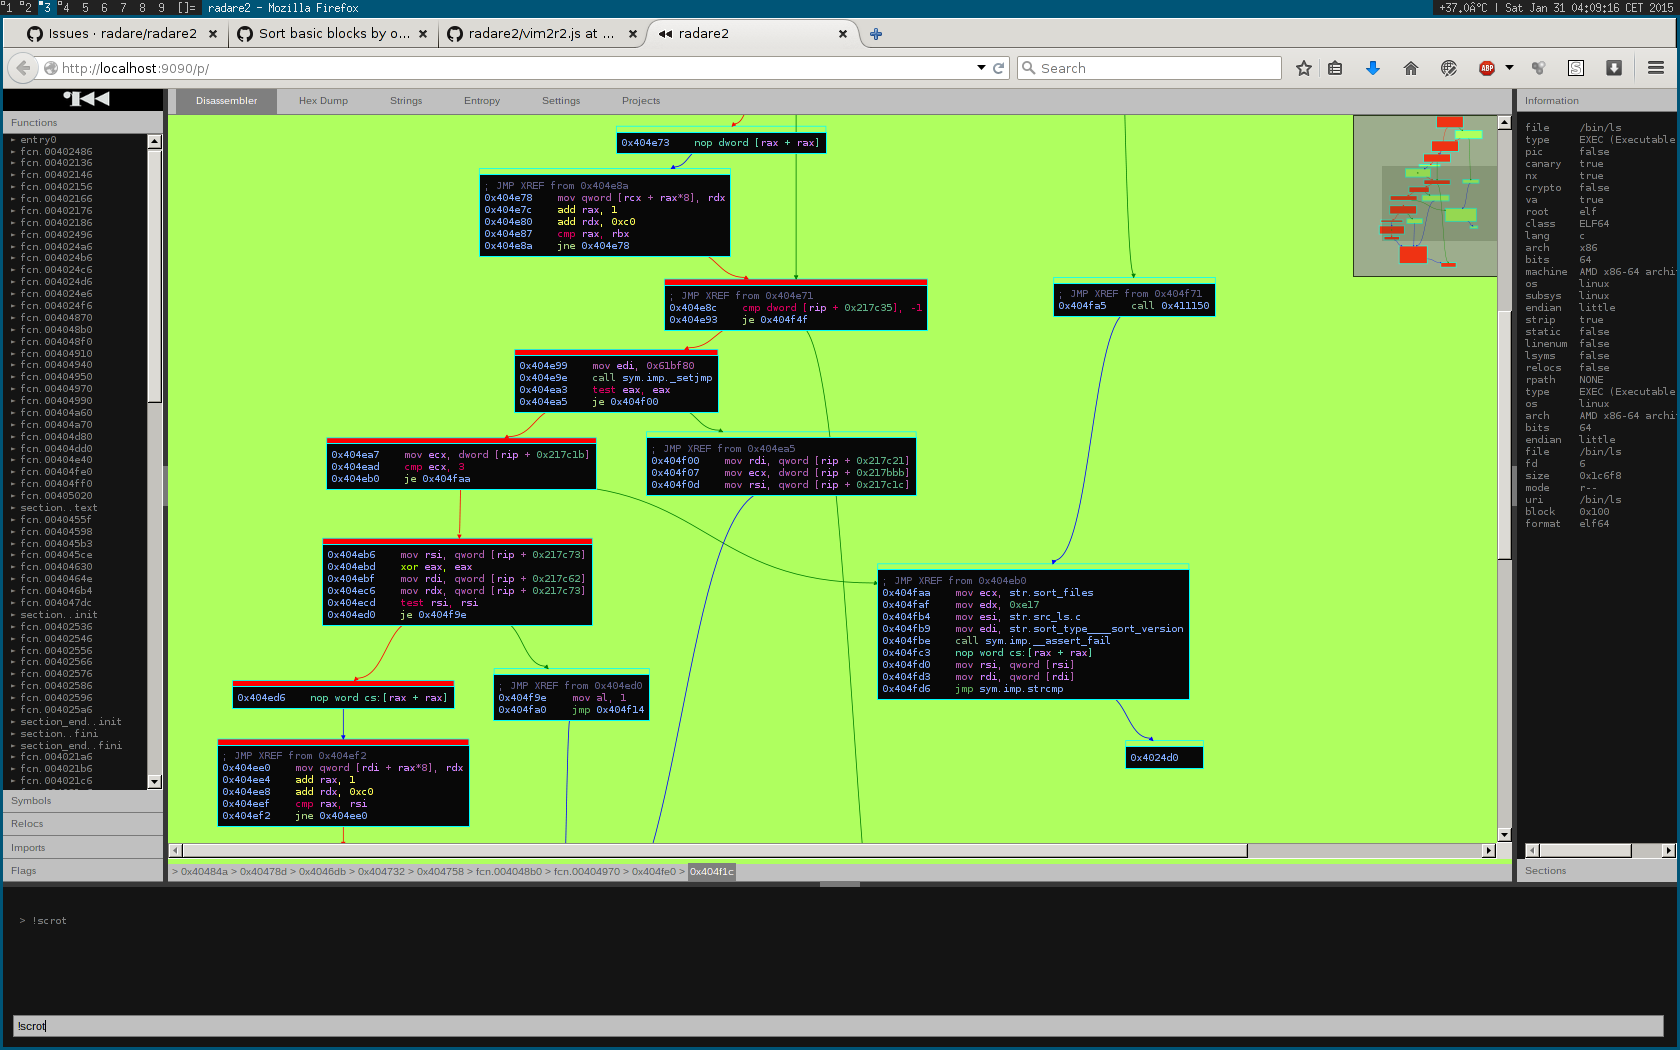
There’s also three different graphs implementations in the WebUI, which works fine with touchscreens, but its still not perfect, you can check the default one by pressing space in the disasm view of r2 -c=H /bin/ls
Ho, and speaking of graph, tracing information from the debugger or the esil emulation is now displayed in the web interface!
Future plans for graphs are:
- Better layout (no more overlapping nodes)
- Support Colors
- Support UTF-8
- Group nodes
- Add comments in nodes
- Save/Restore graph states (wip in the webui)
- Print graph to file
- Generic API and commandline tool to create graphs like
dotdoes. - Better WebUI graphs
If you want to do any of those things feel free to checkout the code libr/core/graph.c.