GSoC 2018 Final: Console Interface Improvementes
August 19, 2018
Introduction
Hi, I’m cyanpencil and I was selected for the Console Interface Improvement task for the 2018 edition of the GSoC.
I had a lot of fun spending this summer coding for radare. I learned so many things, and had an amazing experience overall. I am very grateful to my mentors, Xvilka, Pancake and Maijin, they were always present and closely followed me during the entire summer.
My task was to improve some aspects of the terminal interface of radare2. Here you can find a more detailed description of the GSoC task. Unfortunately I didn’t manage to complete all the subtasks listed in the project idea; However, I also took care of many things that were not included in the original task. There is still a huge amount of work to do: radare2 is still not very much user friendly, but it’s definitely getting better with time.
Improvements of the graph drawing commands (ag*)
The commands for drawing graphs in radare2 (all those starting with ag) had a bit confusing syntax. Even when consulting the help (ag?), it was not exactly clear what graph a certain command would draw and how. I implemented a new syntax for those commands (ag<graph type><output format>) and made sure to support every type / format combination.
Here’s the new ag? help that summarizes my changes:
[0x00005000]> ag?
|Usage: ag<graphtype><format> [addr]
| Graph commands:
| aga[format]             Data references graph
| agA[format]             Global data references graph
| agc[format]             Function callgraph
| agC[format]             Global callgraph
| agd[format] [fcn addr]  Diff graph
| agf[format]             Basic blocks function graph
| agi[format]             Imports graph
| agr[format]             References graph
| agR[format]             Global references graph
| agx[format]             Cross references graph
| agg[format]             Custom graph
| ag-                     Clear the custom graph
| agn[?] title body       Add a node to the custom graph
| age[?] title1 title2    Add an edge to the custom graph
|
| Output formats:
| <blank>                 Ascii art
| *                       r2 commands
| d                       Graphviz dot
| g                       Graph Modelling Language (gml)
| j                       json ('J' for formatted disassembly)
| k                       SDB key-value
| t                       Tiny ascii art
| v                       Interactive ascii art
| w [path]                Write to path or display graph image (see graph.gv.format and graph.web)
Graph Jumptables
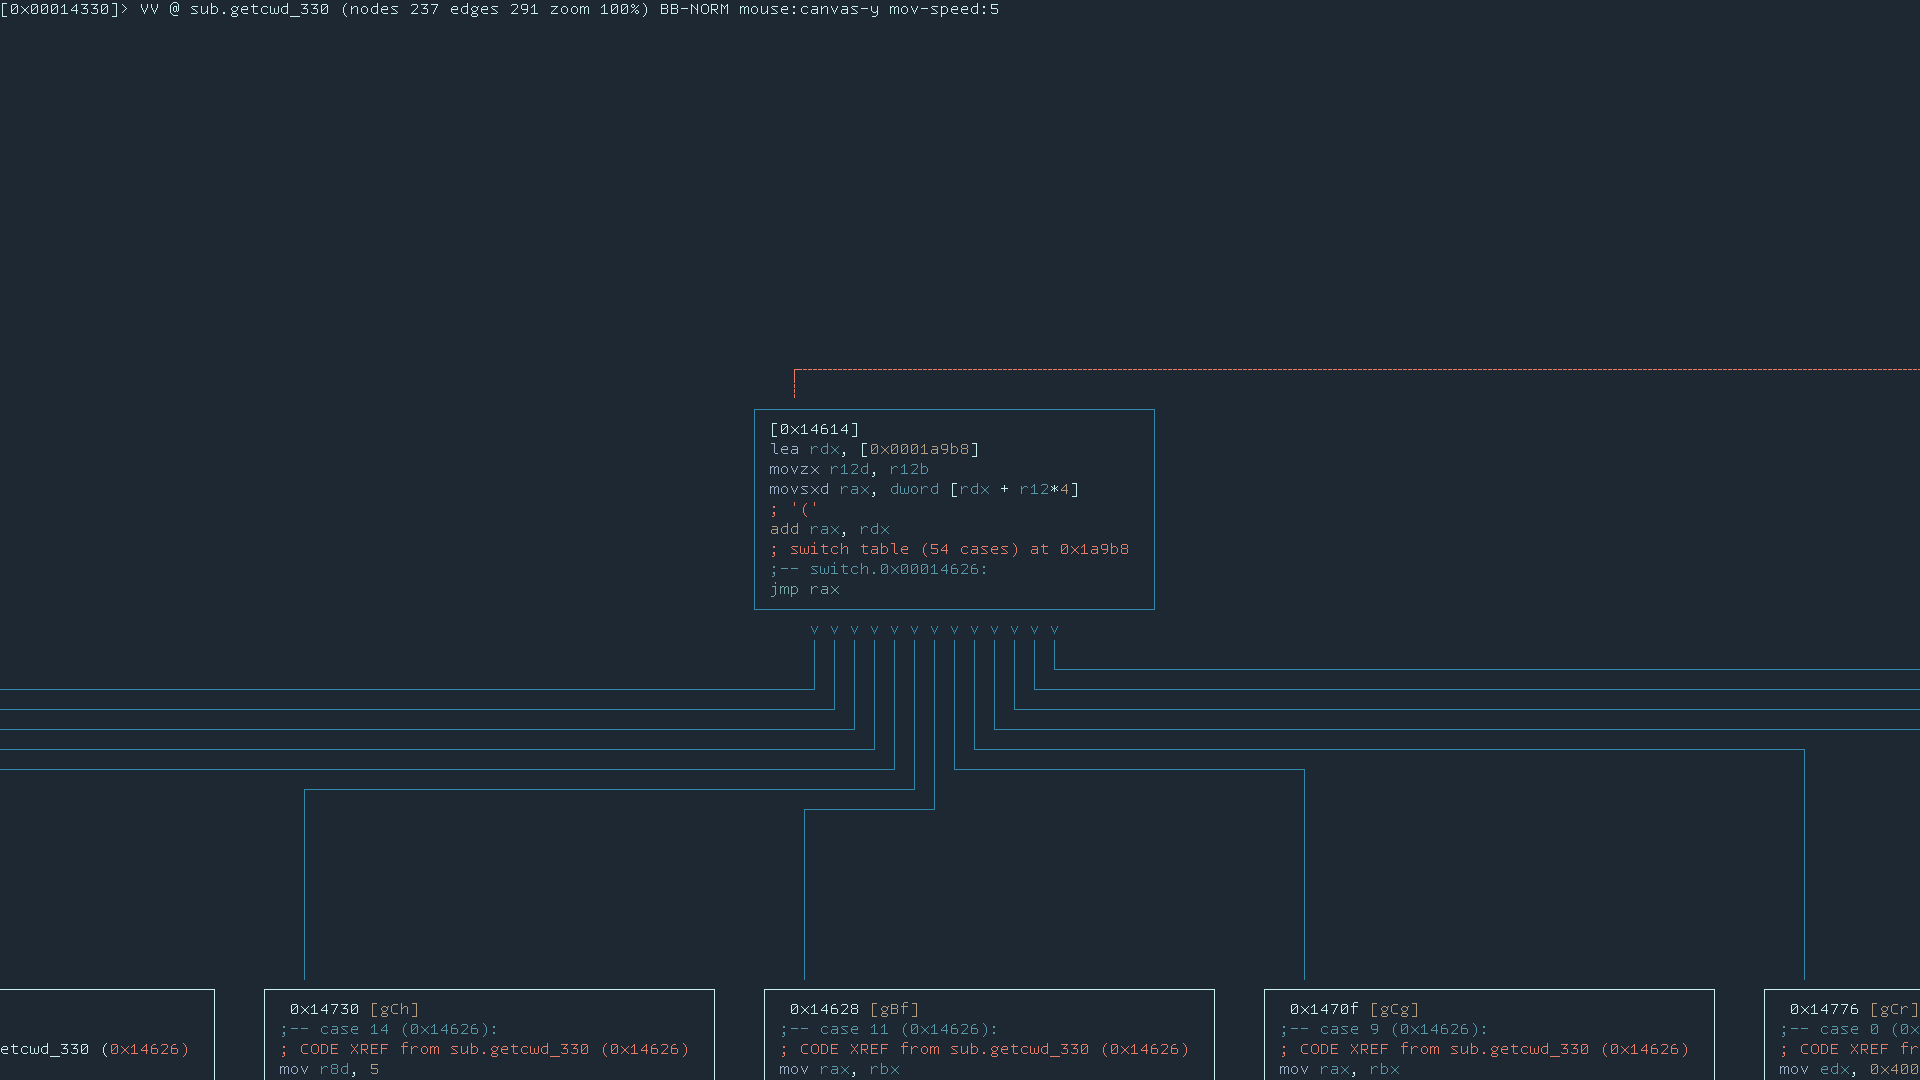
Jumptables were creating a lot of trouble in ascii-art graphs, and most of the times the resulting layout was broken. See this issue to see what were the problems. I tried my best to make the layout better, and this is what I came out with:
 Graph view of a switch statement
However, there are still some problems to fix with graph edges (in particular, there are a bit too many overlaps).
UTF-8 support in canvas
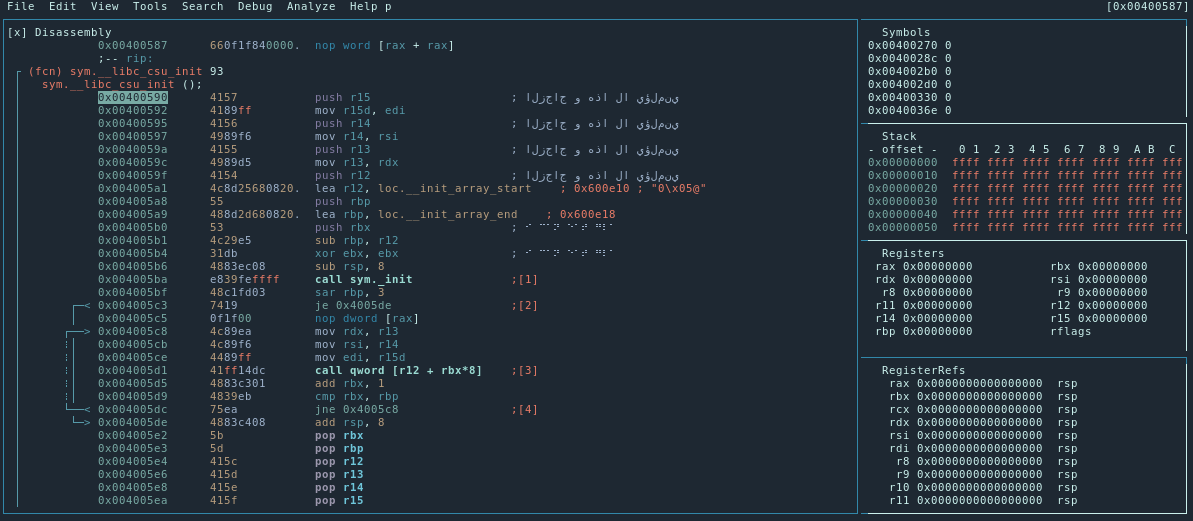
RConsCanvas, radare2’s own way of drawing complex interfaces in the terminal, had some glitches with UTF-8 characters because it didn’t take into account the different byte-length of those special characters. Implementing the support for UTF-8 took quite a lot of time because it meant rewriting many things from scratch and because I had to keep intact the support for ANSI escape codes.
But I’m pretty happy with the result, as now with UTF-8 we can create even more beautiful interfaces:
 Here’s a screen of the “panels” view with some comments in arabic and braille
Autocompletion widget in visual offset prompt
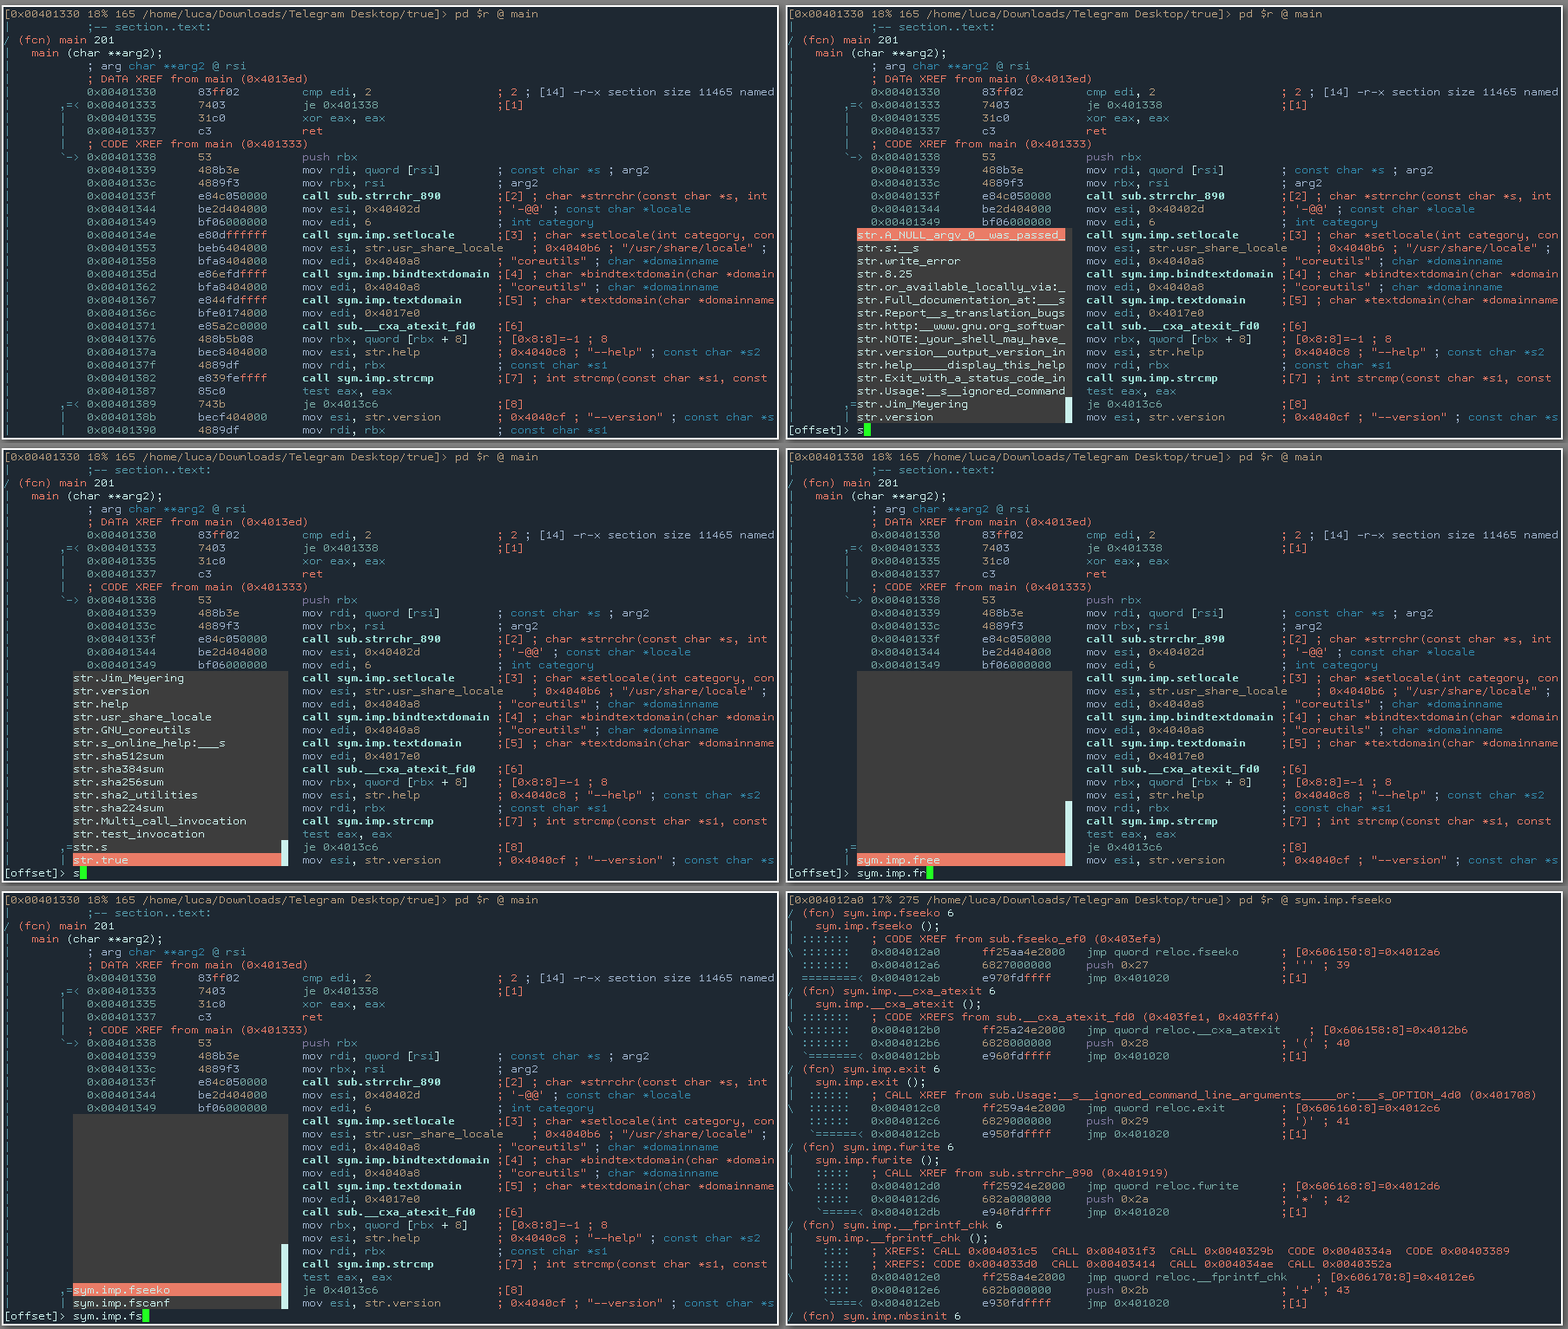
Radare2 already had autocompletion in the visual offset prompt, which worked similarly to bash’s autocompletion. My job was to make it more visually appealing by implementing something similar to the autocompletion inside (terminal) vim, where an interactive widget appears under the cursor. Here’s the result:
 A gif demonstrating the scrolling of the autocompletion widget while in visual offset prompt
Other fixes / contributions
My work included taking care of a lot of other small issues and minor graphical glitches. Here you can find every contribution I made in this summer: