GSoC 2nd stage and RSoC 1st stage report
August 14, 2017
GSoC 2nd stage and RSoC 1st stage report
Good morning ladies and gentlemen. As you probably know radare2 project was overly busy this summer by hosting Google Summer of Code and our own - Radare Summer of Code, 5 students in total. Woot, but now as summer comes to a close, we would like to report the progress from each of our students!
Srimanta Barua (GDB server and client)
Compared to the feature-implementing frenzy of the first phase, the second phase of GSoC involved more bug-fixes and closing of old issues.
First I fixed a bug where r2 was reporting support for vCont packets and not using them. Next, I added support for pid/tid specific continue, and continue with signal (dck in r2).
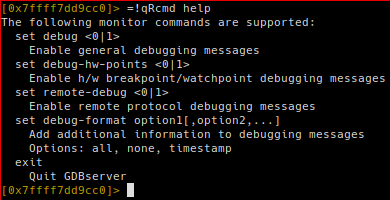
The next feature I added was =!qRcmd to the gdb io system, so that one could send monitor commands to be run by the target gdbserver. Next, I closed a very old issue by adding a drp sub-command to parse a gdb maintenance register profile into an r2
one.
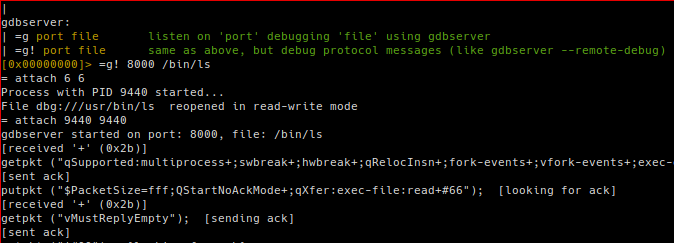
Then I added the capability to read the filename that was executed from the gdbserver (even with the io system, with =!exec_file). Also support for reading the list of threads running for the process. Adding the printing of debug messages to the r2 gdbserver will help the implementation of the protocol. With the help of this, I added support for reading/writing single registers to gdbserver, and also better reporting of stop reason.
Next I added support for reporting of debug info with di, an io system command to
get/set the maximum packet size with =!pktsz, and proper handling of stop reason
to the r2 gdb client.
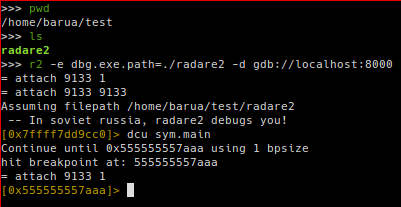
Finally, closing another very old issue, I added automatic loading of symbol information
in gdb debugging (provided either the binary is present locally at the same absolute path
as on the target, or in the current working directory). In addition, one can set the
path of the binary in the local system, with e dbg.exe.path.
Windows support (xarkes)
As for this month, I continued working on the windows platform support. I started with adding the idp command, which will read symbols from a .pdb file. For instance you can load symbols into your radare2 session like this by calling .idp* [user32.pdb] (the ‘*’ character stands for ‘output in radare commands’ and ‘.’ for ‘load’ – many radare2 commands use the same syntax). I also added the pdb.autoload configuration which allows radare2 to automatically fetch the pdb files and load the symbols for each loaded library while debugging a Portable Executable.
The other big thing I worked on is the debugging of libraries. This is not merged yet because we are still thinking about the concept but I already added library functions execution with rarun2. You can call a specific function with this command:
$ rarun2 runlib=/lib/libc-2.25.so runlib.fcn=system arg1="ls /"
This will execute as intended system("ls /"). Rarun2 is totally portable and you can even use it on Windows:
>rarun2.exe runlib=C:\Windows\System32\user32.dll runlib.fcn=MessageBoxA arg1=%0 arg2="This is the body text" arg3="Title" arg4=%0
The % format is used to pass directly an integer to a function, rather than a char pointer.
Now if one’s really want to debug a library function, one can still call radare2 over rarun2:
$ radare2 -d rarun2 runlib=/lib/libc-2.25.so runlib.fcn=system arg1="ls /"
But radare2 won’t break automatically on the function call, a few steps or breakpoints are required before.
I had the time to fix some issues related to PDB file loading, msvc demangle information, network path handling (e.g. \\VBoxSRV\bins\bin.exe) and meson build improvements. Talking about building, I also added the generation of .sdb files when compiling with meson build system, which means that next release should be very stable for Windows users.
About August, I already started working on improving the Windbg support. I think that most of this month will be focused on this task as Windbg protocol is not documented and current support lacks a lot of features.
Reverse Debugging (rkx1209)
This month, I started first from adding “debug continue back” dcb command, which can unwind program counter backward until it hit the latest breakpoint.
So if you set a breakpoint once, then you can always return back to that point from any place you like:
[0x004028a0]> db 0x004028a2 # Break at 0x4028a2
[0x004028a0]> 10dso
[0x004028a0]> dr rip
0x004028b9                  # Step out 10 times
[0x004028a0]> dcb           # Continue back until last breakpoint
[0x004028a0]> dr rip
0x004028a2                  # Now backed to 0x4028a2
I also added dtst command, which can export current trace sessions to file. The file path can be specified by e dir.dbgsnap=/path/to/file. And of course, you can import sessions from file by dtsf command.
[0x004028c2]> dtst records_for_test
Session saved in records_for_test.session and dump in records_for_test.dump
[0x004028c2]> dtsf records_for_test
session: 0, 0x4028a0 diffs: 0
session: 1, 0x4028c2 diffs: 0
Moreover, I added dtsC command, which can leave a comment to each trace session. It can be usefull for users who analyze lcomplex program to keep key information in their mind.
[0x004028c2]> dtsC 0 program start
[0x004028c2]> dtsC 1 decryption start
[0x004028c2]> dts
session: 0   at:0x004028a0   "program start"
session: 1   at:0x004028c2   "decryption start"
Finally, I added aesb command, which is step back function for ESIL.
Yes. radare2 has now reverse debugging capability in ESIL mode.
To seek program counter backward in ESIL mode, firstly you need to save the trace session by aets+ command:
[0x00404870]> aets+
And then, you can step back by aesb:
[0x00404870]> aer rip
0x00404870
[0x00404870]> 5aeso
[0x00404870]> aer rip
0x0040487d
[0x00404870]> aesb
[0x00404870]> aer rip
0x00404879
Following tasks are what’s in for August:
- Implement watchpoint, that can be usefull when used with reverse debugging functions.
- Add more tests for reverse debugging, trace session and watchpoint.
rune (chinmay_dd)
For rune, I started off with improving the existing console interface. Users can now set registers and memory addresses as symbolic or give them constant values. I also added a simple way to save these configurations to a project as a JSON file so that it becomes easier to load them once the current execution run is over.
As explained in this blog article, we moved API functions into a new repository called radare2-r2pipe-api since we wanted to keep the core functionality of the r2pipe completely separate from the higher level abstractions and structures (to be used in libraries such as radeco-lib and rune).
The Context API consisted of functions which could allow modification of memory and registers as well. But, in the long run we want this tool/library to be used by researchers and enthusiasts to try out their own implementations with each of the decomposable modules such as Context, Explorer and Engine. Hence, all memory abstractions were moved into a new trait called Memory and all register related operations into a trait called RegStore. Context is now generic over any combination of types A and B where A implements Memory and B implements RegStore. This made sure that we can very easily plug memory model implementations and things would just work!
rune only supported 64 bit memory operations up until now. I worked on an implementation of a Segment-based Memory Model which handles single byte symbolization of memory. You can read here to know more about the implementation details. High-level idea:
1.  Input: Read for 2 bytes at memory 0x9000
    Memory:
    -------------------
    | 0x9000 - 0x9002 |
    -------------------

2.  Input: Read for 2 bytes at memory adress 0x9003
    Memory:
    -------------------    -------------------
    | 0x9000 - 0x9002 |    | 0x9003 - 0x9005 |
    -------------------    -------------------

3.  Input: Access for 3 bytes at memory address 0x9001
    Memory:
    -------------------           -------------------
    | 0x9000 - 0x9002 |           | 0x9003 - 0x9005 |
    -------------------           -------------------
              ^       ^ ^       ^ ^       ^
              |       | |       | |       |
              -- bv1 -- -- bv2 -- -- bv3 --

    Here,
    bv1: Result of extract operation on bitvector representing memory at 0x9000.
    bv2: Newly created bitvector representing memory of length 1 byte at 0x9002.
    bv3: Result of extract operation on bitvector representing memory at 0x9003.

    * A result bitvector of size equal to the access size is created
      and is initialized to zero.

    * bv1, bv2 and bv3 are zero extended to match the access size
      (i.e 3 bytes or 24 bits).

    * Depending on the read offset,
      these bitvectors are then left shifted appropriately.

    * The result is then basically the logical OR of all the 4 quantities:
      (We could also use XOR since there are no overlaps)
      result = result ^ bv1 ^ bv2 ^ bv3
Preliminary results seem promising and I am planning to spend some time writing solid tests to cover all cases.
The advantage of having core modules implemented as a trait, enables us to add implementations on the fly. I managed to integrate my DirectedExplorer implementation which allows user to direct the explorer before running the engine so that we can steer the control along branches we want to explore. Ofcourse, we also have the existing BFS and DFS Explorer module which works with the entire setup just fine! :)
Radeco (Zhuo Zhang)
For radeco-lib, I started with fixing the build fails. It last for a long time, from the simple mis-typing to some logical errors like infinite recursion. Now, the newest Pull Request could pass the test, although Value Set Analysis was disabled for I haven’t finish this stage.
After that, I rewrote the algorithm for Common Subexpression Elimination (CSE). Now radeco-lib could find out nearly all the common subexpressions and eliminated the ones within a single basic block. The main idea is sorting the operands of commutative opcodes before CSE by a simple sorting algorithm on SSA. Future work, when the whole working chain is finished, on CSE will be concentrating on cross-blocks elimination.
My main task in 1st stage was building the Memory SSA, or in other words, starting Data Flow Analysis on memory. It’s a long-term work involving Memory SSA Generation, Value Set Analysis (VSA) and Type Inference Analysis. Sadly, I only finished the first part in 1st stage. Now, radeco-lib could generate raw Memory SSA, which only included three kinds of variables and didn’t distinguish different variables of the same kind. If we want more accurate result, we should move into VSA. By the way, the three kinds of variables are local variables which are used on the stack, global variables which are placed onto .bss/.data/.rodata segments and extra variables which are heap variables. All the three kinds of variables correspond the concept, Memory-Regions, in VSA. Thus, the generation would be easily moving forwards.
Of course, the basic structure of VSA has been built after our great Brainstorming, more details are available HERE. If anyone has better ideas or want to communicate with me about VSA, feel free to send me an email.
Nowadays, radeco-lib could support the first part of decompiler, taking radare2 as disassembler, translating ESIL into radecoIL based on SSA, doing CSE and Constant Propagation, and then generating raw Memory SSA. Also, as mentioned, the next step of my job would be concentrating on VSA and Type Inference. It’s an urgent work and if we finish these, the Data Flow Analysis of radeco-lib could be accomplished. I managed to finish these in the 2nd stage and hope the first part of Radeco could work.